How does it work ?
Tension is naturally equilibrating beetween the soil and the internal media of the sensor, as soon as the contact with the soil is established. Focus on the importance of the installion technique, to secure a quick and perfect contact (see “Installation”). We measure an internal resistivity, tightly correlated with water tension. The gypsum buffer saturates the internal media, that becomes independant of soil salinity of (up to 3 mS/cm). The incidence of soil temperature (1 % per °C) is automatically compensated, thanks to a soil temperature measure.
Caracteristics
Sensors are rustical, no maintenance, no disconnection, frost resistant. Installation can be enterely underground (on perrenial crops). They offer a good realibility up to 4K measures, high reproductibilty inter-batch, now good accuracy beetween batches. The range of mesaure is from 0 à 239 Cbars (ou KPa).Kinetics
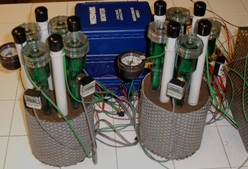
Behaving of WATERMARK® sensors A WATERMARK® sensor, correctly installed, is permanently equilibrated with the soil tension. Its own response time is a few seconds. This can easily be verified by playing with sensors out of the soil. The soil imposes its speed. Observing soils can be surprising. For example, the time needed by certain soils to “come back” from a deep drought, or the time others need to drain, etc … Including degradation of soil structure, that slows down the natural tension equalization. Extreme dessication : We have let a soil dry in our test cylinders to reach an extreme and long lasting drought. To allow observe the behavior of the soil and sensors, during recovery phase. Resulst on batches 2004 and F7 show that Watermark sensors equilibrate without delay and do not keep any memory of the event.
Sensibility
Watermark® sensors have an excellent sensitivity, comparable to tensiometer’s. Since 2014, all Monitors (R2-DM, R2-DL, R2-DX, R2-DXS) activate a second measuring circuit, beetween 0 and 30 cbars, to get an excellent sensitivity at low tension end** . This allows new applications. ** unlike lack of sensibility beetween 0 and 10 cb, that was falsely lended to the sensor, in the 90’s. In fact, dued to the former reading meter.Longevity
20 years of experience, intensively using more than 200 000 WATERMARK® sensors (ourselves and our customers) , plus systematic testing of sensor batches, gives us recurrent data : on annual crops, longevity is classicaly of 6 campains of 3-4 months or 5 campains of 5-6 months, or 4000 measures. On perennial crops, longevity of sensors is 4 entire years or 4000 measures. After, one observes a drift, generally upward.Variability
WATERMARK® sensor is constituted of natural materials :- big avantage for the realism of the measure
- disavantage is a possible variabilty of row material
Correction factor
Not the case of batches now in service, but certain batches need a correction factor. Table of correction factors and longevity, that turns around 4000 / 4500 measures.| Batch | marketed | Coeff. | Annual crop | Perrenial crop |
|---|---|---|---|---|
| F18 | mid 2017 – 2018 | 1.1 | Previ : 5 seasons | Previ : 4 years |
| F16 | mid 2015 – mid 2017 | 0.9 | Previ : 5 seasons | Previ : 4 years |
| F13 | may 2013 – 2014 – mid 2015 | 1.0 | 5 seasons | 4 years |
| F11 | april 2011 – 2012 – 2013 | 1.4 | 6 seasons | 4 years |
| F9 | may 2009 – 2010 – 2011 | 1.0 | 4 seasons | 3 years |
| F7 | 2007 – 2008 – 2009 | 1.1 | 4 seasons | 3 years |
| F5 | 2005 – 2006 | 1.2 | 6 seasons | 4 years |
| 2004 | 2004 – 2005 | 1.0 | 6 seasons | 4 years |
With Irrometer Co, we constanly improve the of Watermark® sensors, developping new applications, opening new fields.
In Europe, the technical quality standards are high :
- 6 sensors per field (up to 32) for a minimum statistical reliability
- a dedicated installing tool for a good installation (essential)
- mounted sensors for practical aspects in field
- Batch pre-tested and followed for a good reproductibility
- On-line graphs and videos for quick and easy interpretations.
