New :
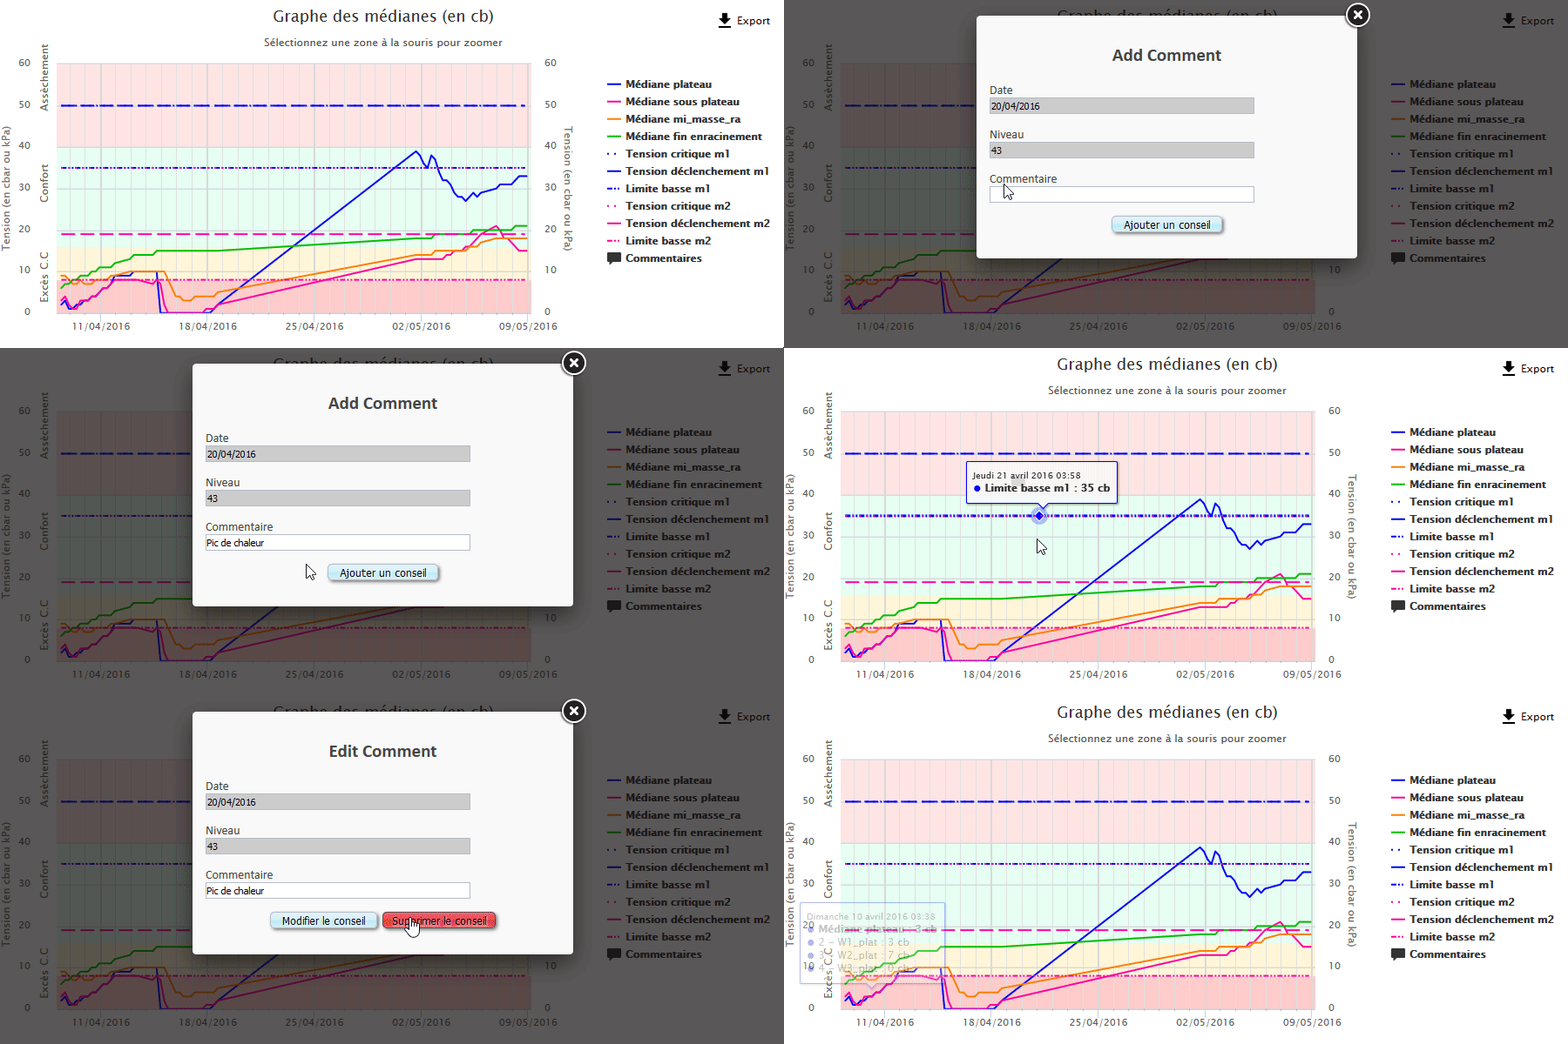
A dialog box is available under the charts, allowing exchanges beetween adviser and irrigator
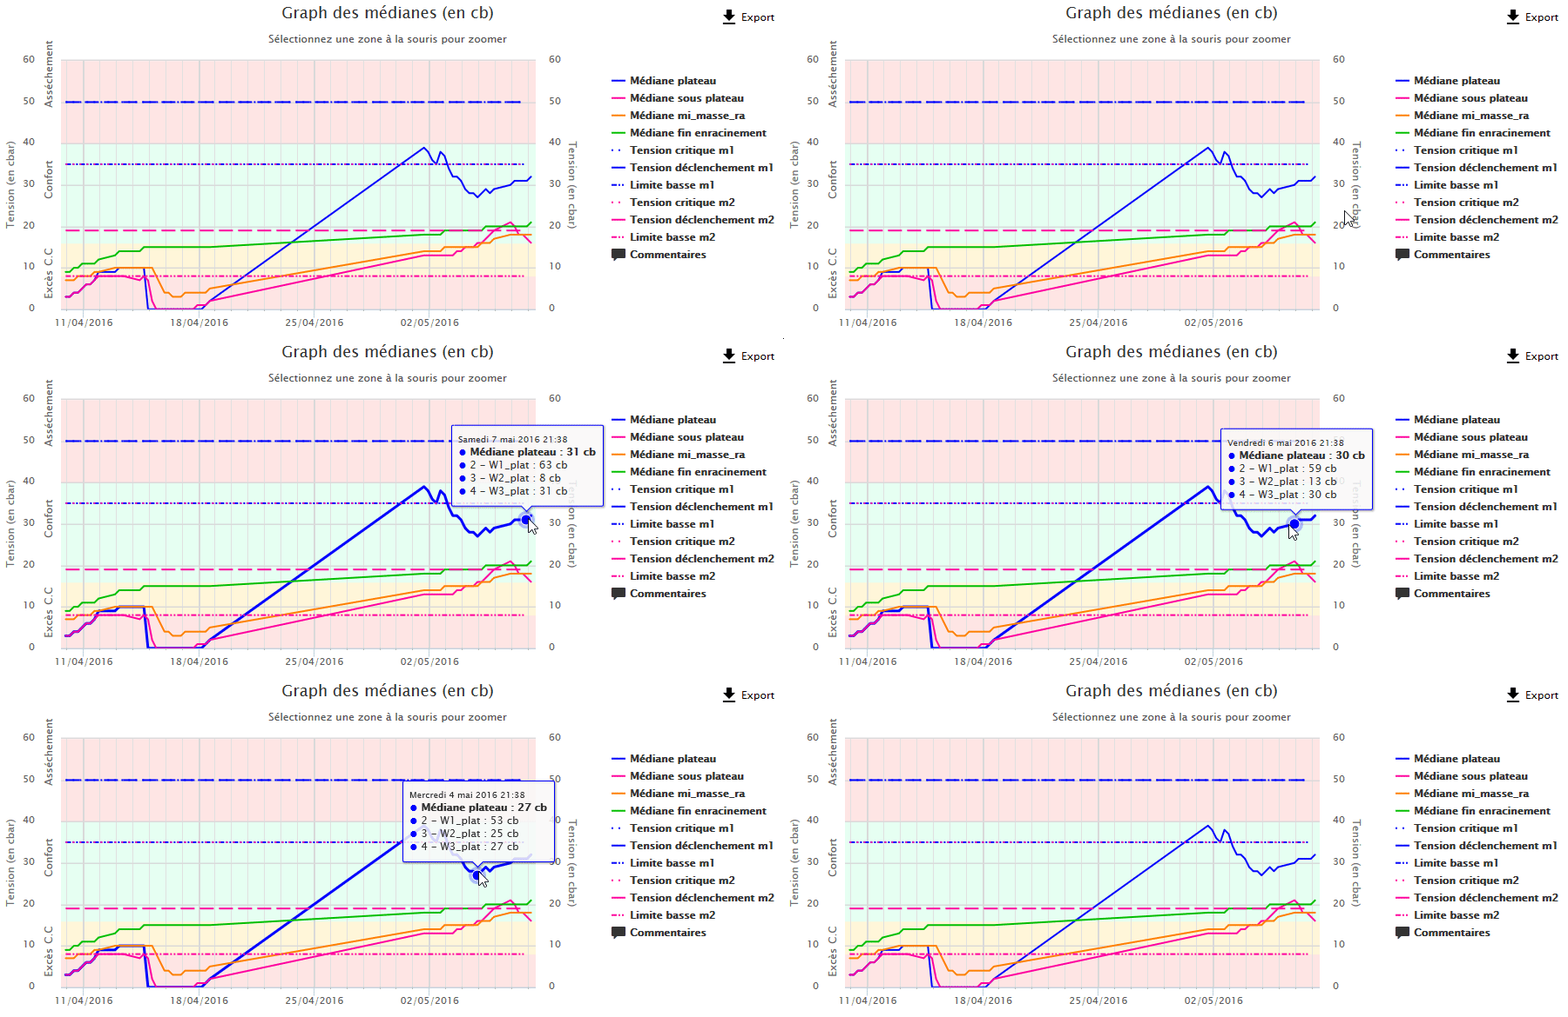
Detail of the median :
See demo below : pointing on a median curve shows the constituting values.
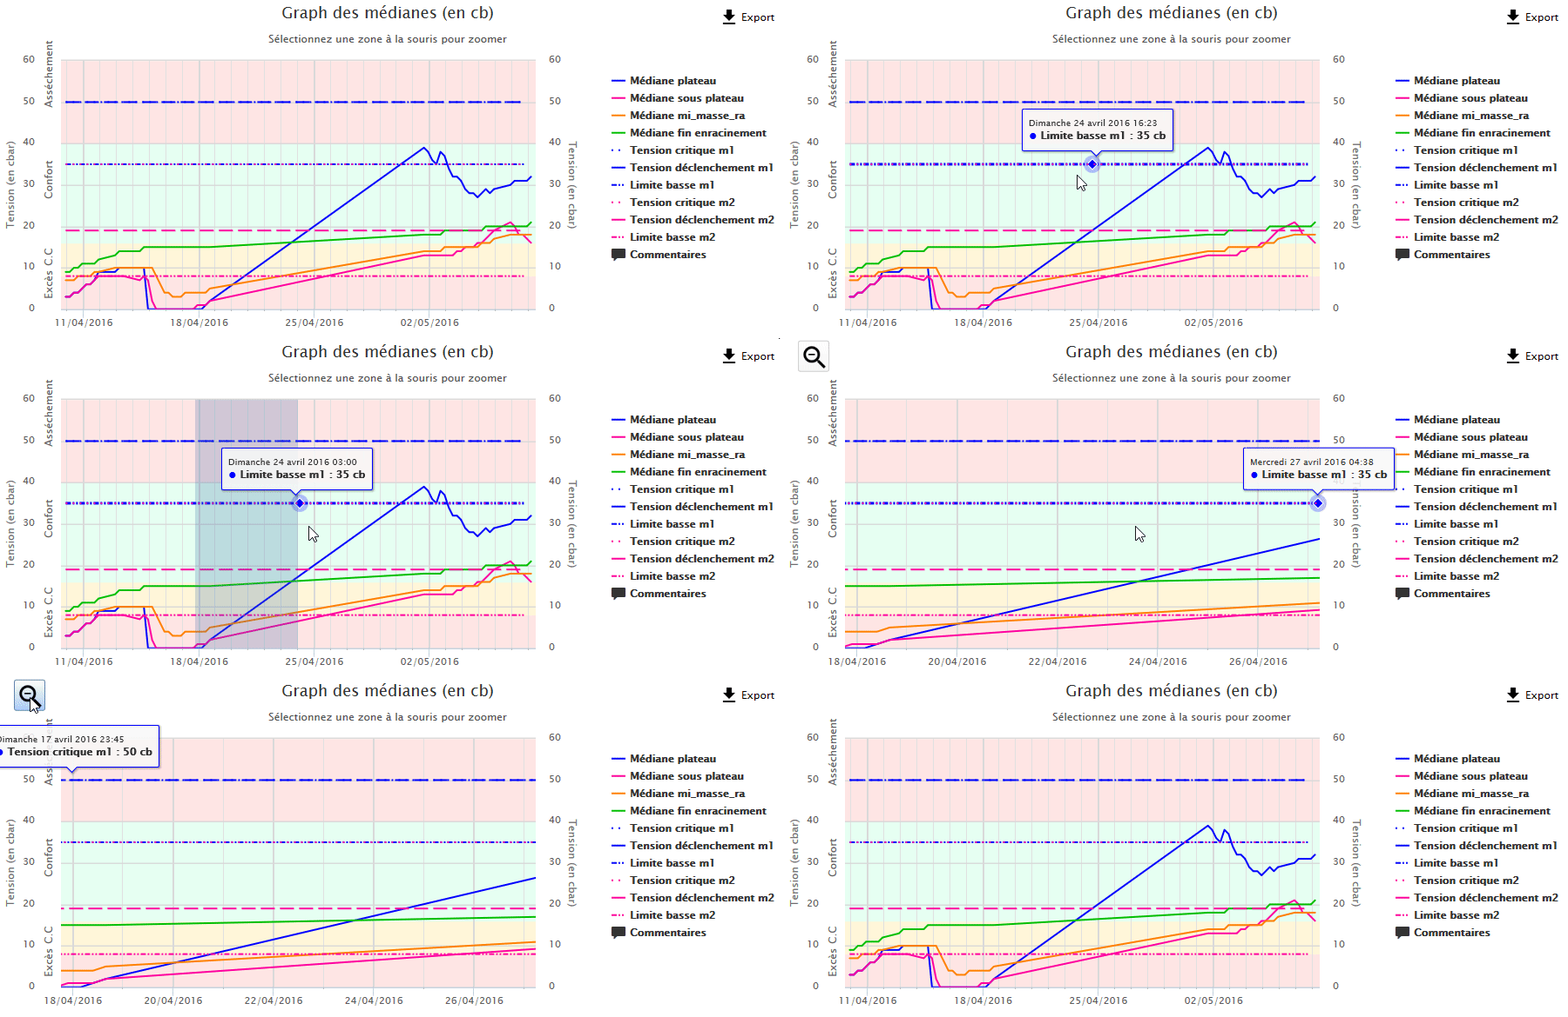
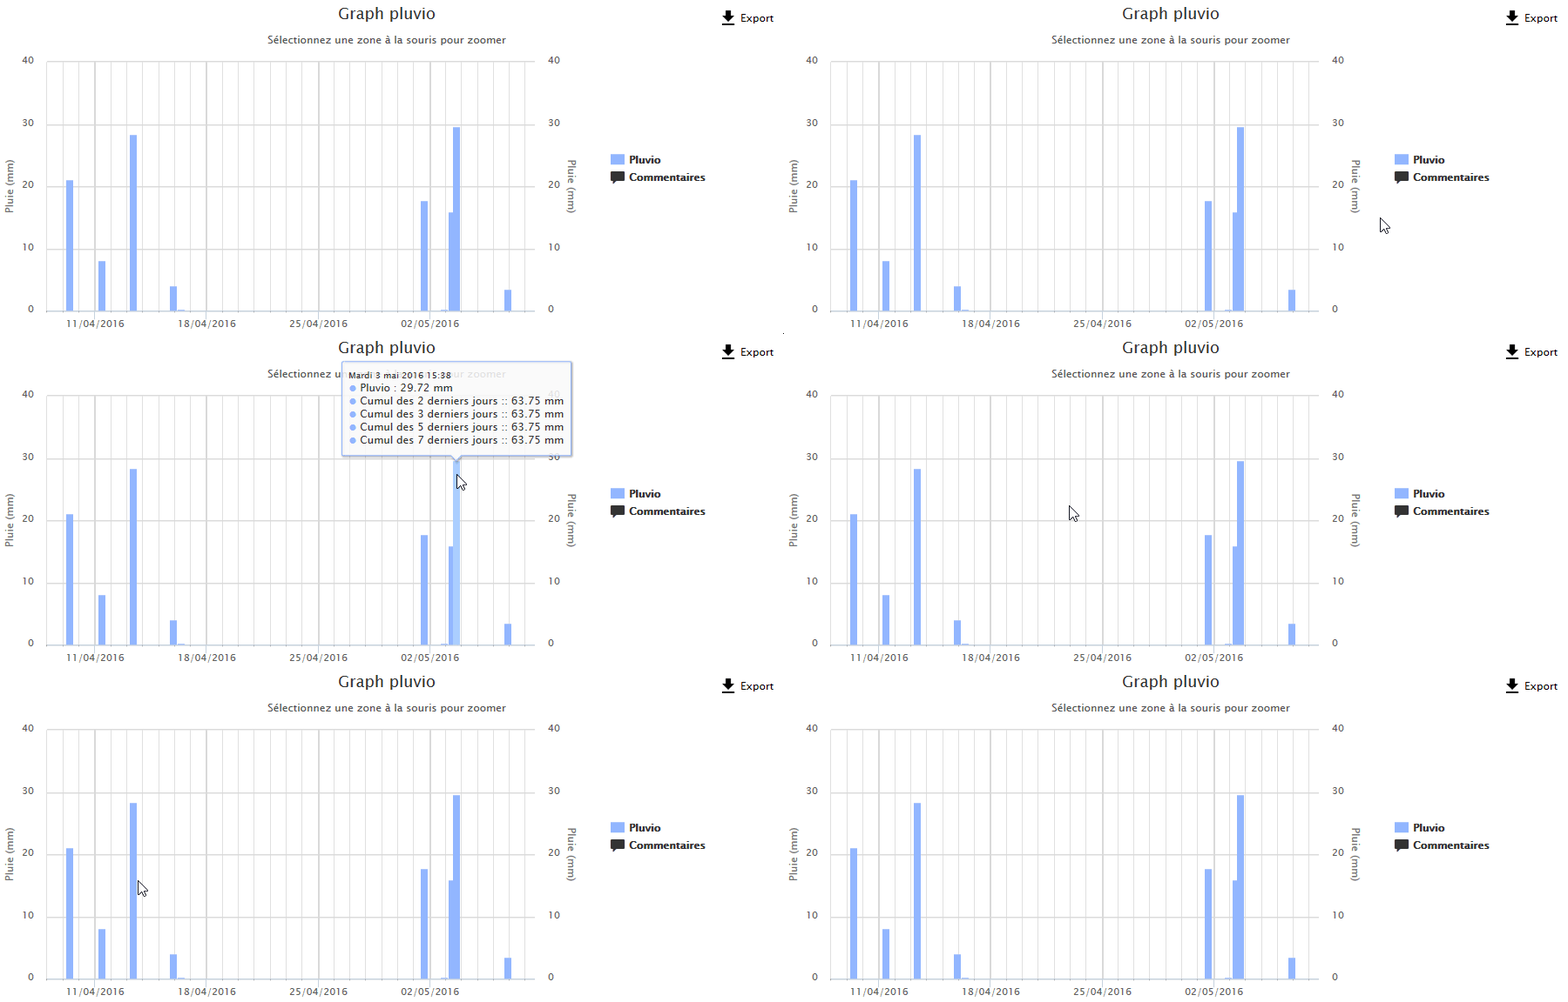
Zoom on a period of time :
See demo below : one can zoom by selecting a surface with the mouse. Can be dezommed with a clic on upper left boton .
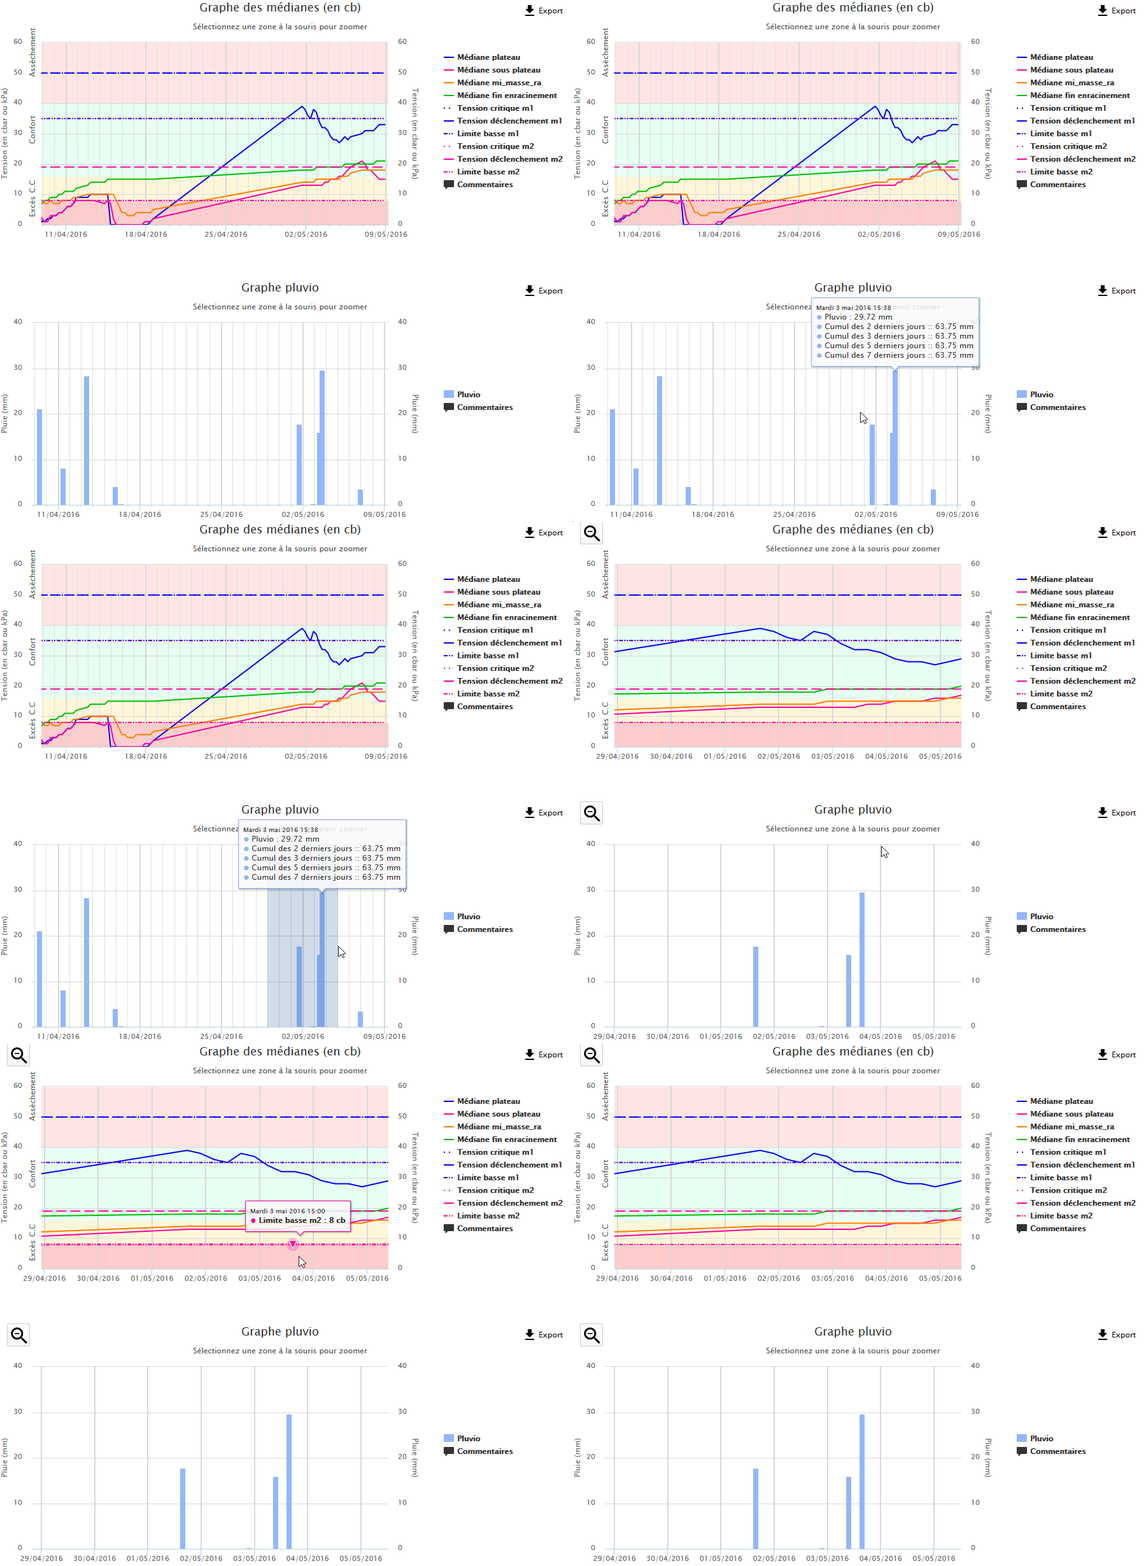
Synchronised zoom :
When dezomming a graph, all the graphs of a page display on the same interval of time.
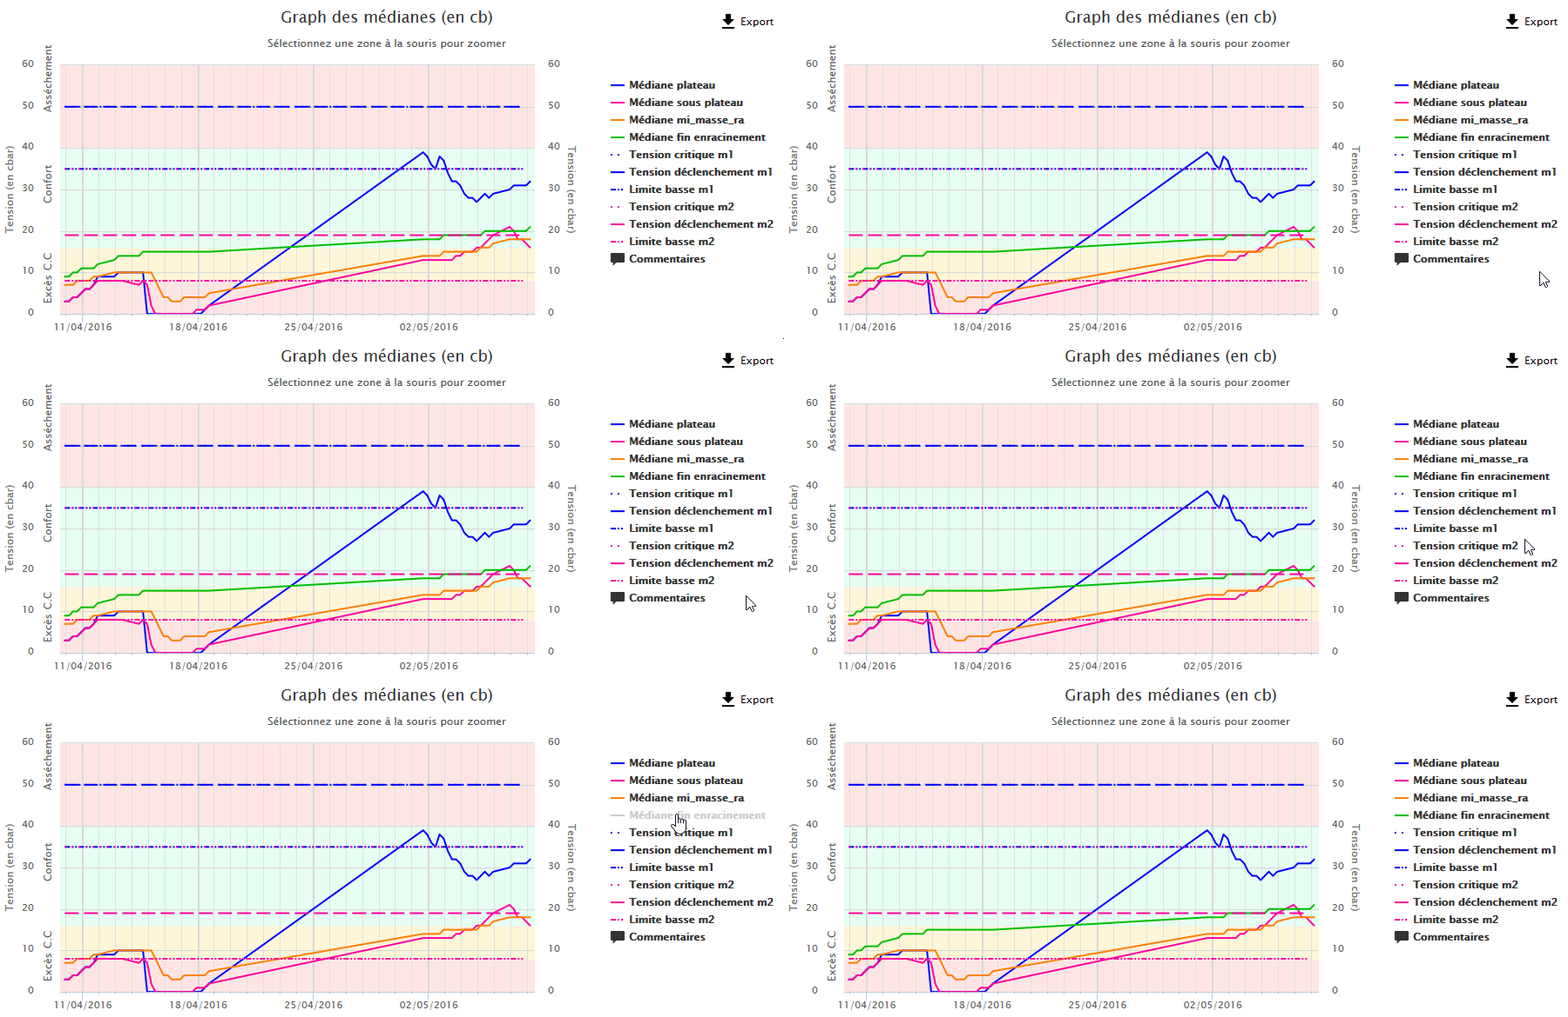
Fonction on the legend :
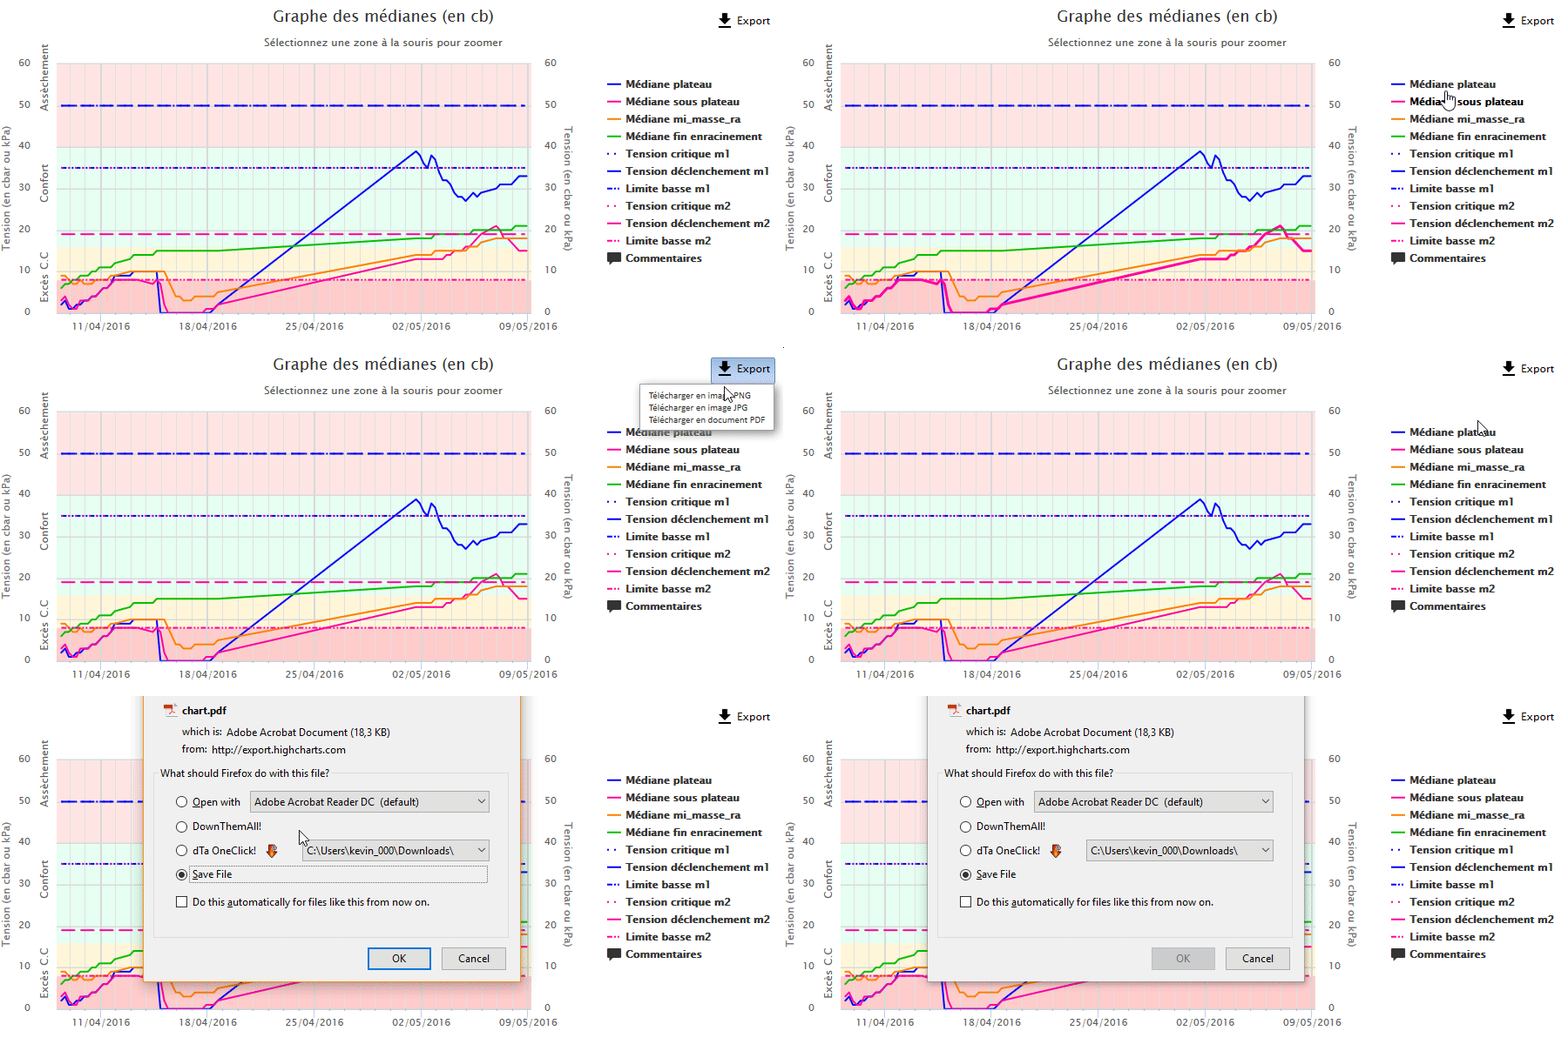
See demo below : one can show / hide a curve, with a clic on its legend.
Pointing without clic on the legend, highligths the corresponding curve.
Comments
See demo below : by pointing on a sticker, one can read comments.
Comments are also listed under the graph
“Add comment” appears and cancel too. A clic on the graph, allows to add a sticker with comment, on the same spot.
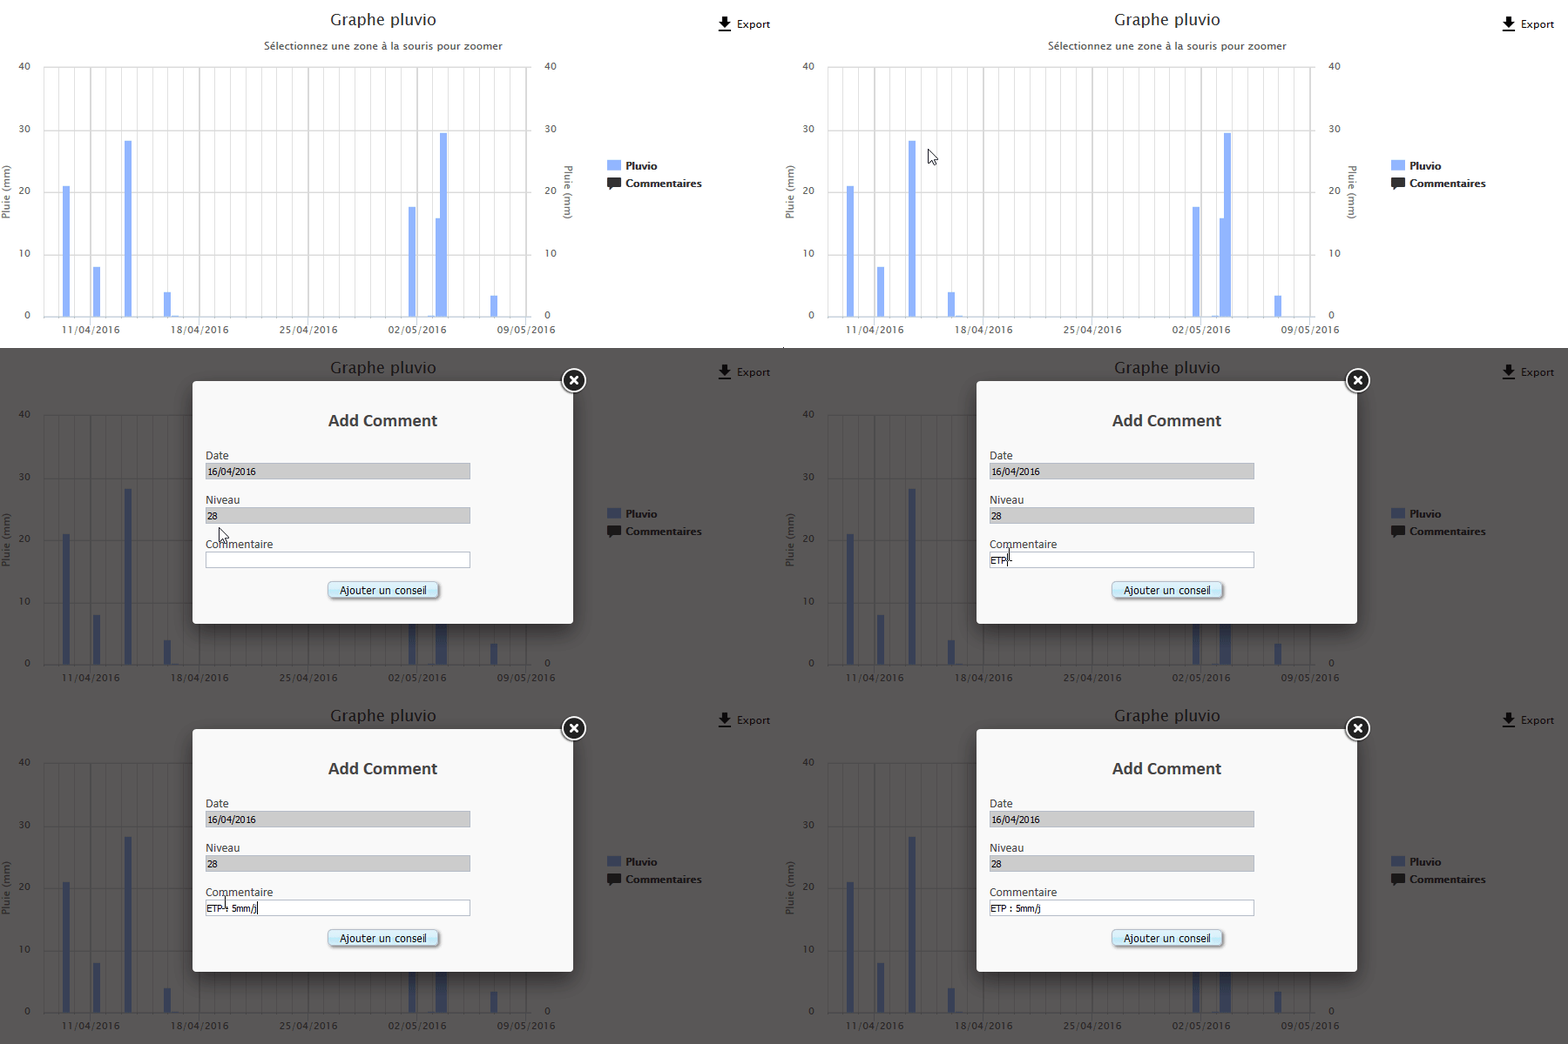
One can add a comment on the pluviometer graph. See below.
Export of graphs
With the menu “Export” it is possible de get a PDF document or an image of the graph.

